Practical commentary and visual guides to the credit protections, settlement structures, and exposure controls used across payments and commercial relationships.
Credit Analyst Training
Build your commercial credit skills.
Eight modules with topical instruction, practice questions, and 80% mastery assessments. Modules 1–3 are free and open to everyone; Modules 4–8 are part of paid enrollment.
Eight modules covering adjudication, credit structure, portfolio risk, stress testing, problem credits, and committee leadership. Topic practice and 80% module assessments reinforce each step. Modules 1–3 are free; Modules 4–8 are part of paid enrollment.
For professionals entering financial technology. Learn payments, product economics, customer protection, technology operations, and responsible launch decisions. Eight modules with topic practice, workshops, and 80% assessments. Modules 1–3 are free; Modules 4–8 are part of paid enrollment.
For new analysts and business professionals. Build skills in reliable data, SQL, statistics, dashboards, forecasting, and defensible recommendations. Eight modules with topic practice, workshops, and 80% assessments. Modules 1–3 are free; Modules 4–8 are part of paid enrollment.
In a payment service provider, merchant exposure changes after approval. This opinion piece sets out how Credit and Operations can share the signals, decisions, and accountability needed to respond.
Opinion · Peter Weitl · Four-page PDF
One merchant. One exposure.
Credit turns approval into usable operating terms. Operations brings back evidence from settlement, refunds, disputes, and merchant behavior. The article also identifies four opportunities for AI-assisted work, with their benefits, pitfalls, and required controls.
Credit and Legal: Make the Contract Carry the Risk
Credit can measure a merchant’s exposure, but Legal must help turn that analysis into clear, workable rights. This companion opinion piece examines the partnership from merchant onboarding through changes in risk and potential distress.
Opinion · Peter Weitl · Four-page PDF
Credit + Legal. Make risk enforceable.
Explore how the teams can connect exposure estimates to reserve and payout provisions, guarantees, notice, and sponsor-bank obligations. The article also identifies benefits, pitfalls, and controls for AI-assisted agreement review and case preparation.
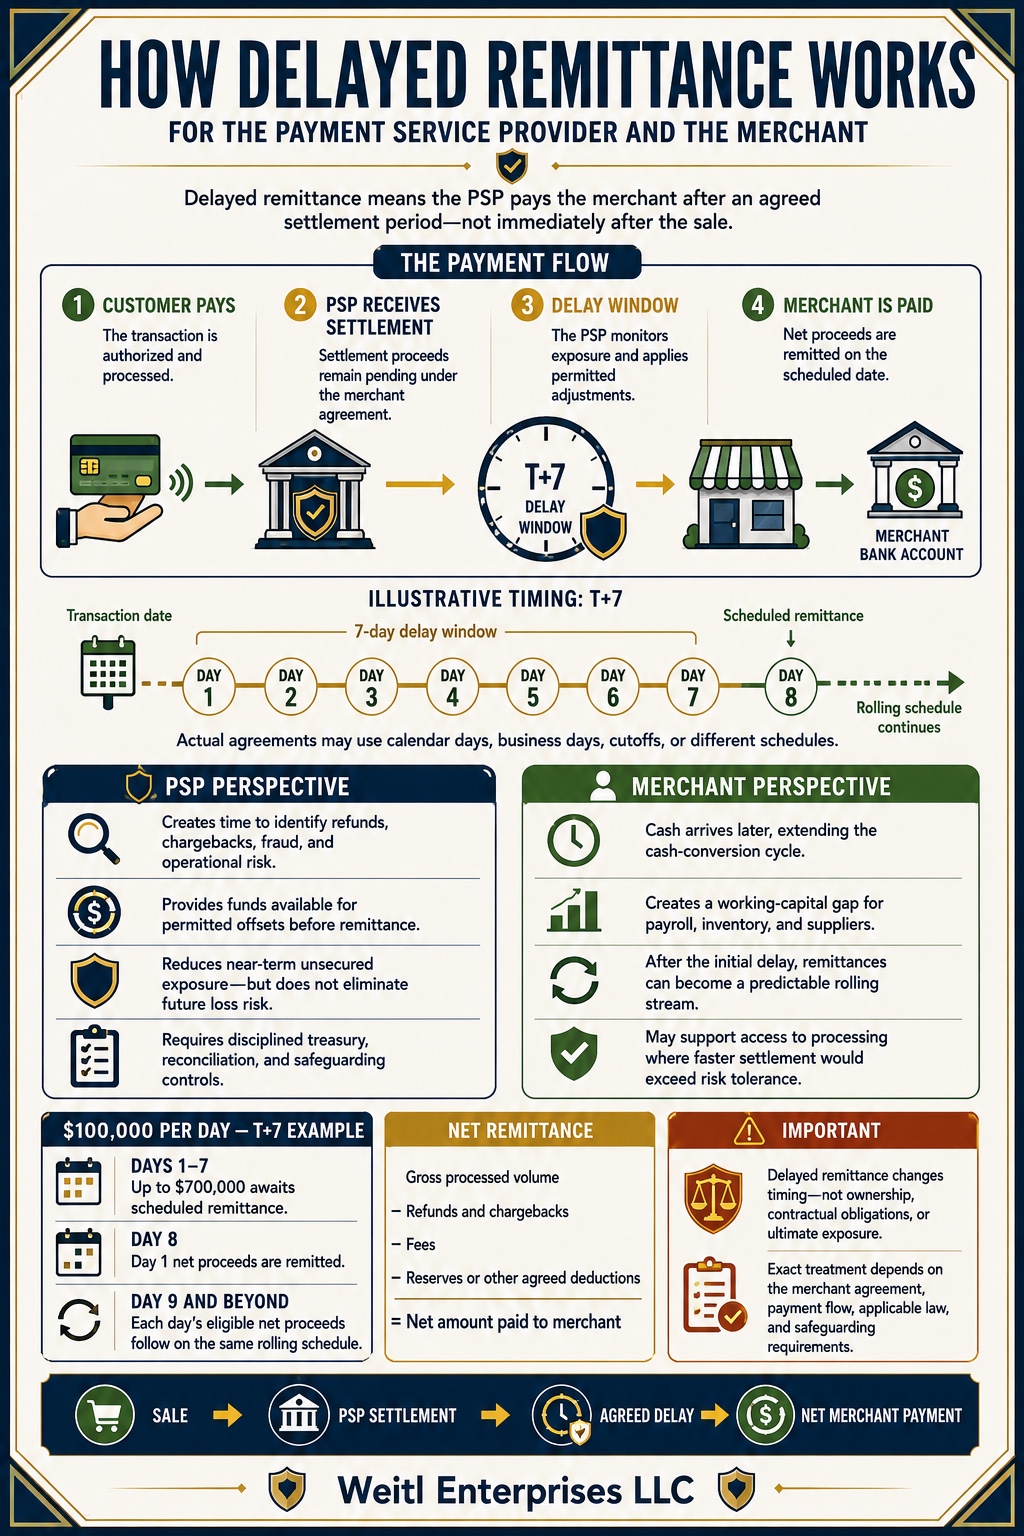
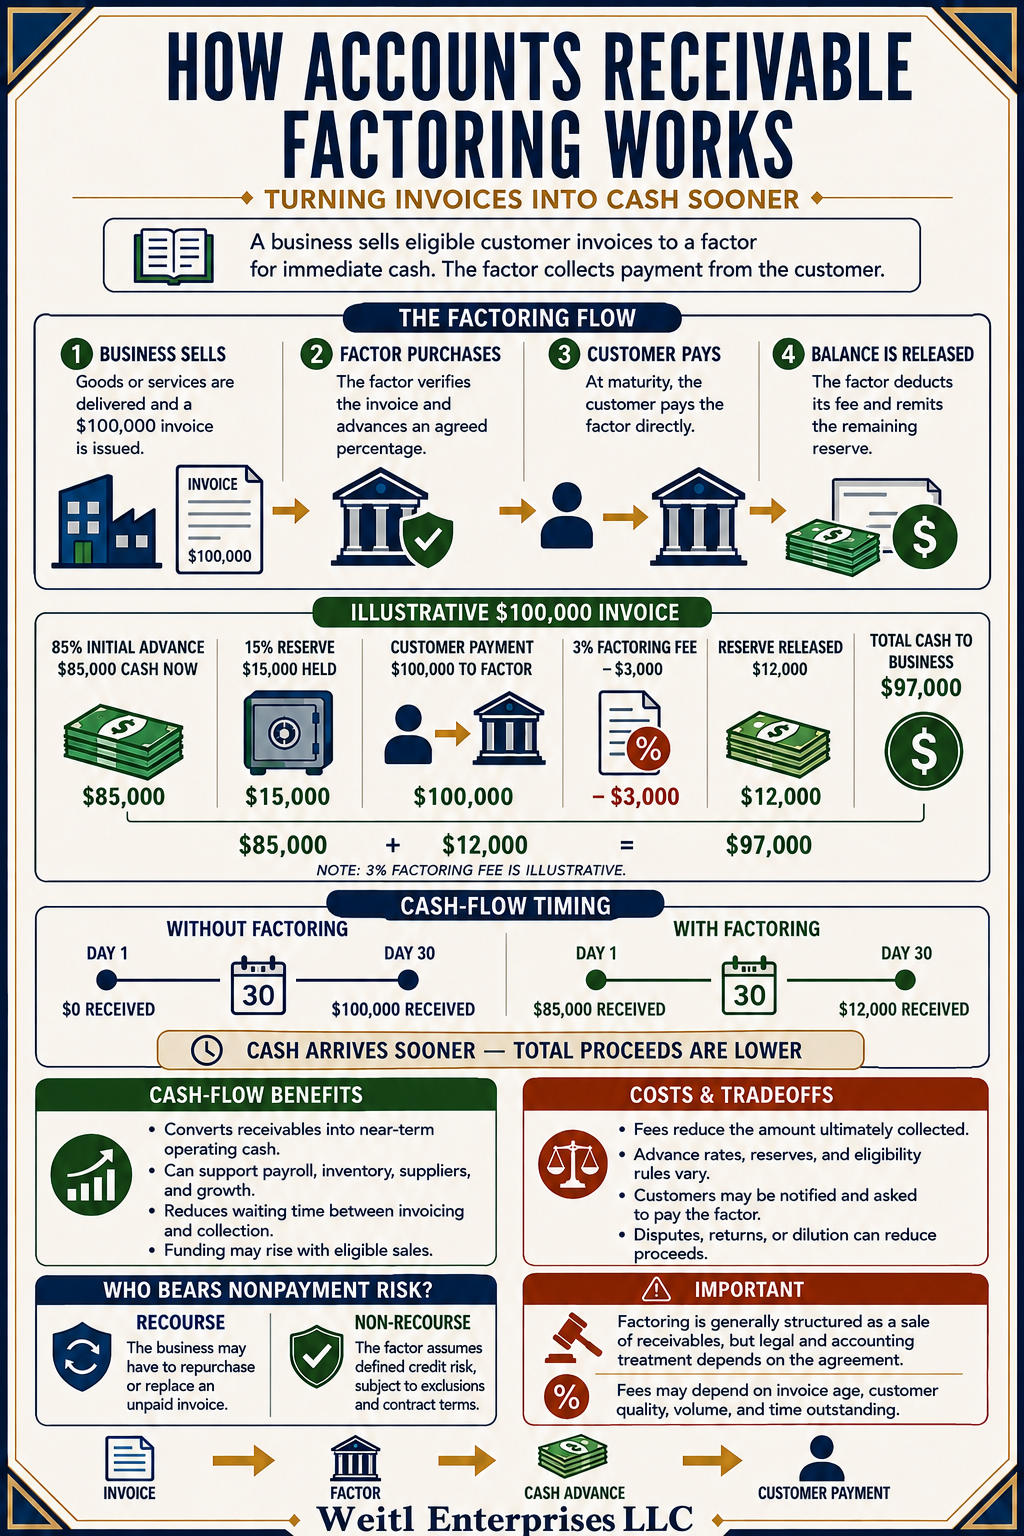
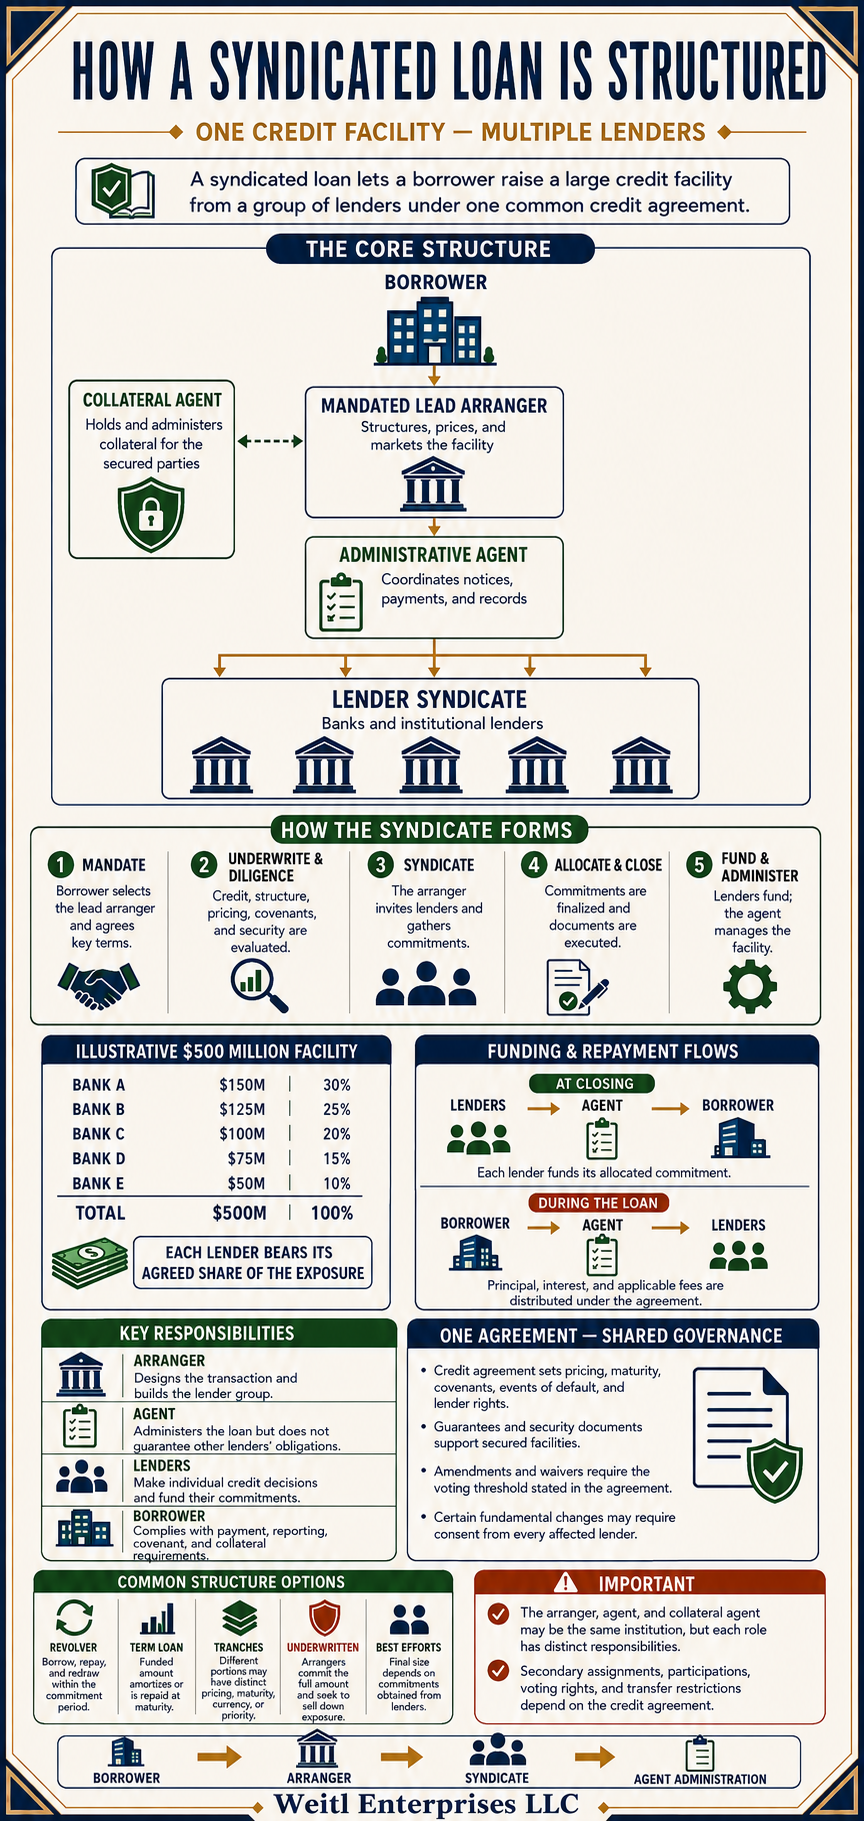
Each guide explains how a commonly used risk-control structure works, who it protects, and where the underlying financial exposure remains.
Standby letter of credit
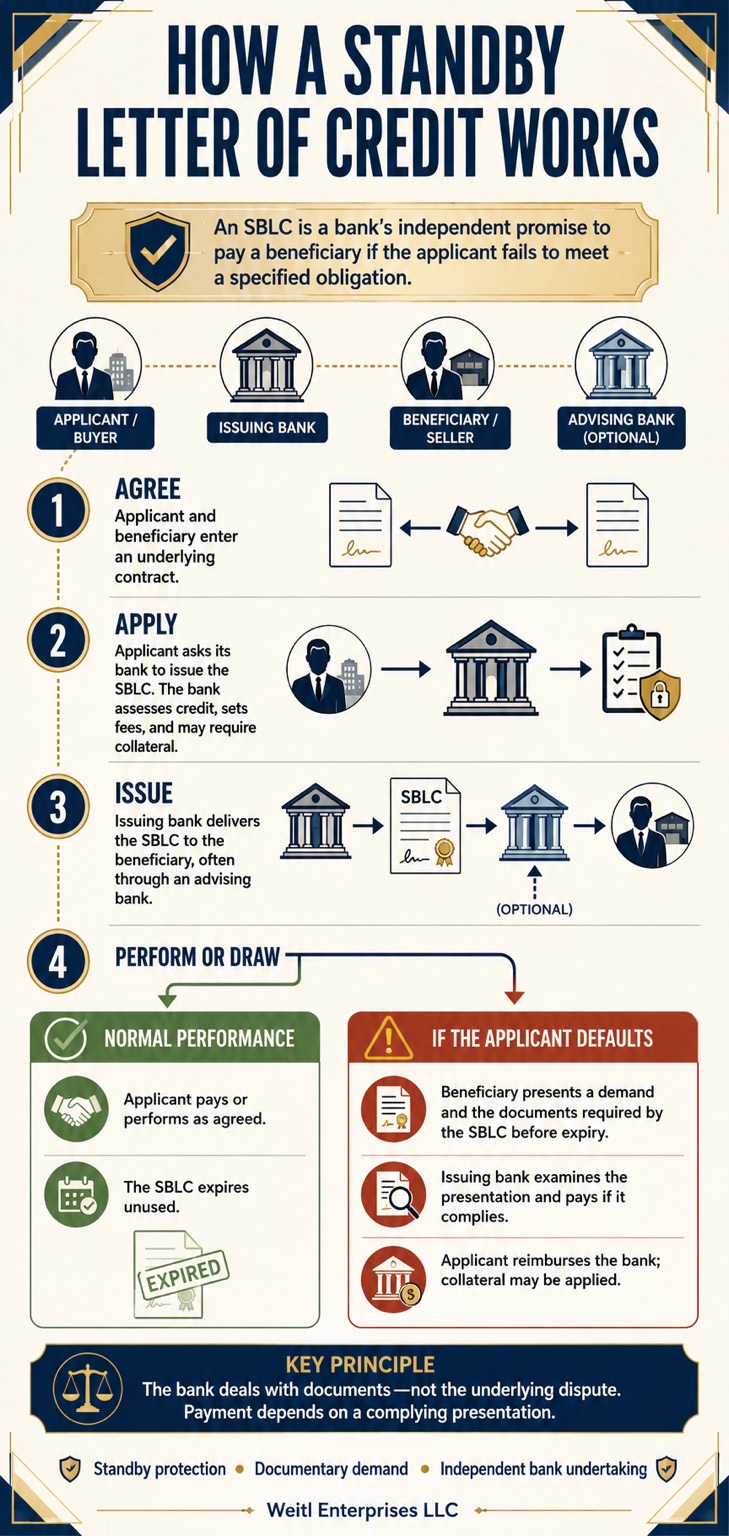
How an SBLC works
Follow the agreement, application, issuance, performance, and draw process—and see why the bank’s obligation remains independent of the underlying contract.
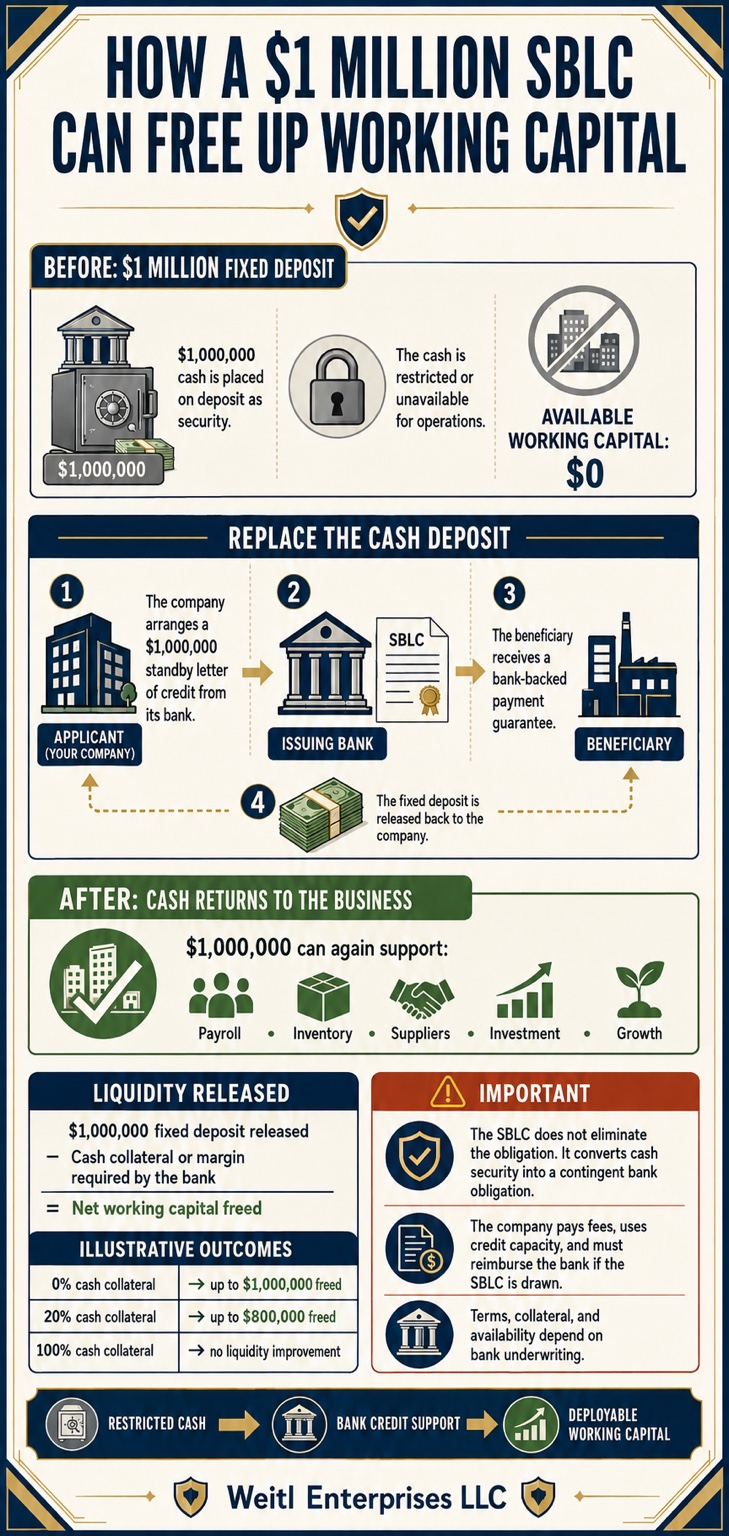
Compare a restricted cash deposit with bank credit support, including the effect of collateral requirements on the amount of liquidity actually released.
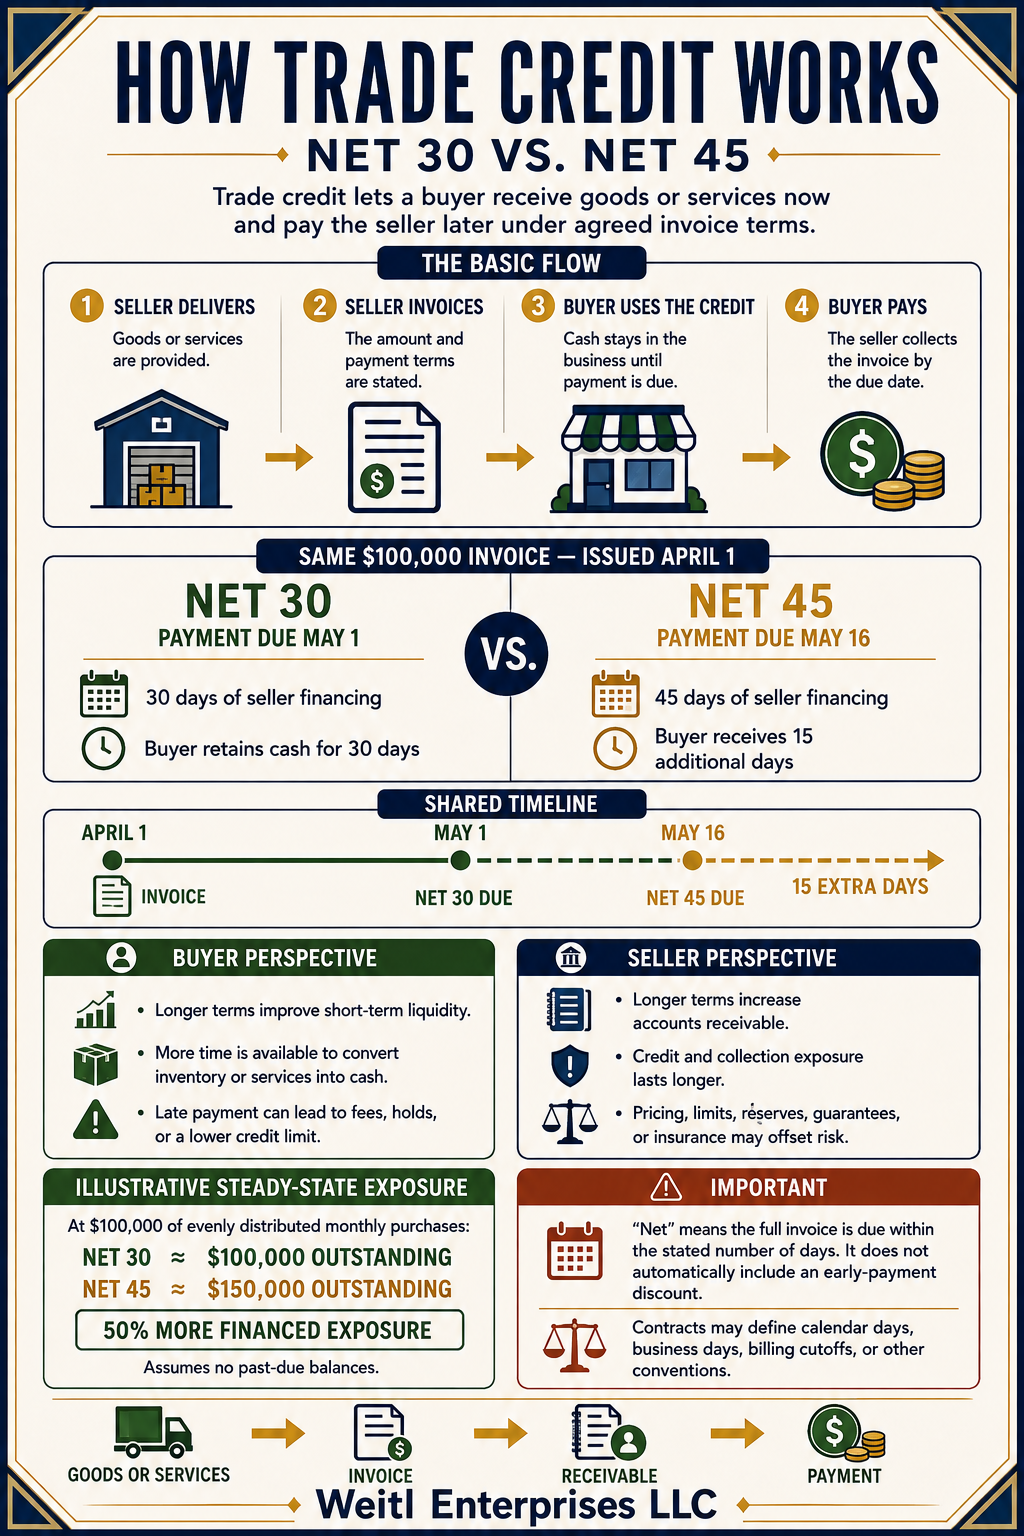
Understand how payment terms and receivables financing affect liquidity, working capital, collection timing, and the amount of credit exposure carried by a seller.
Trade credit
How Net 30 and Net 45 terms work
Compare payment dates, buyer liquidity, seller financing, and steady-state exposure using a shared $100,000 invoice example.
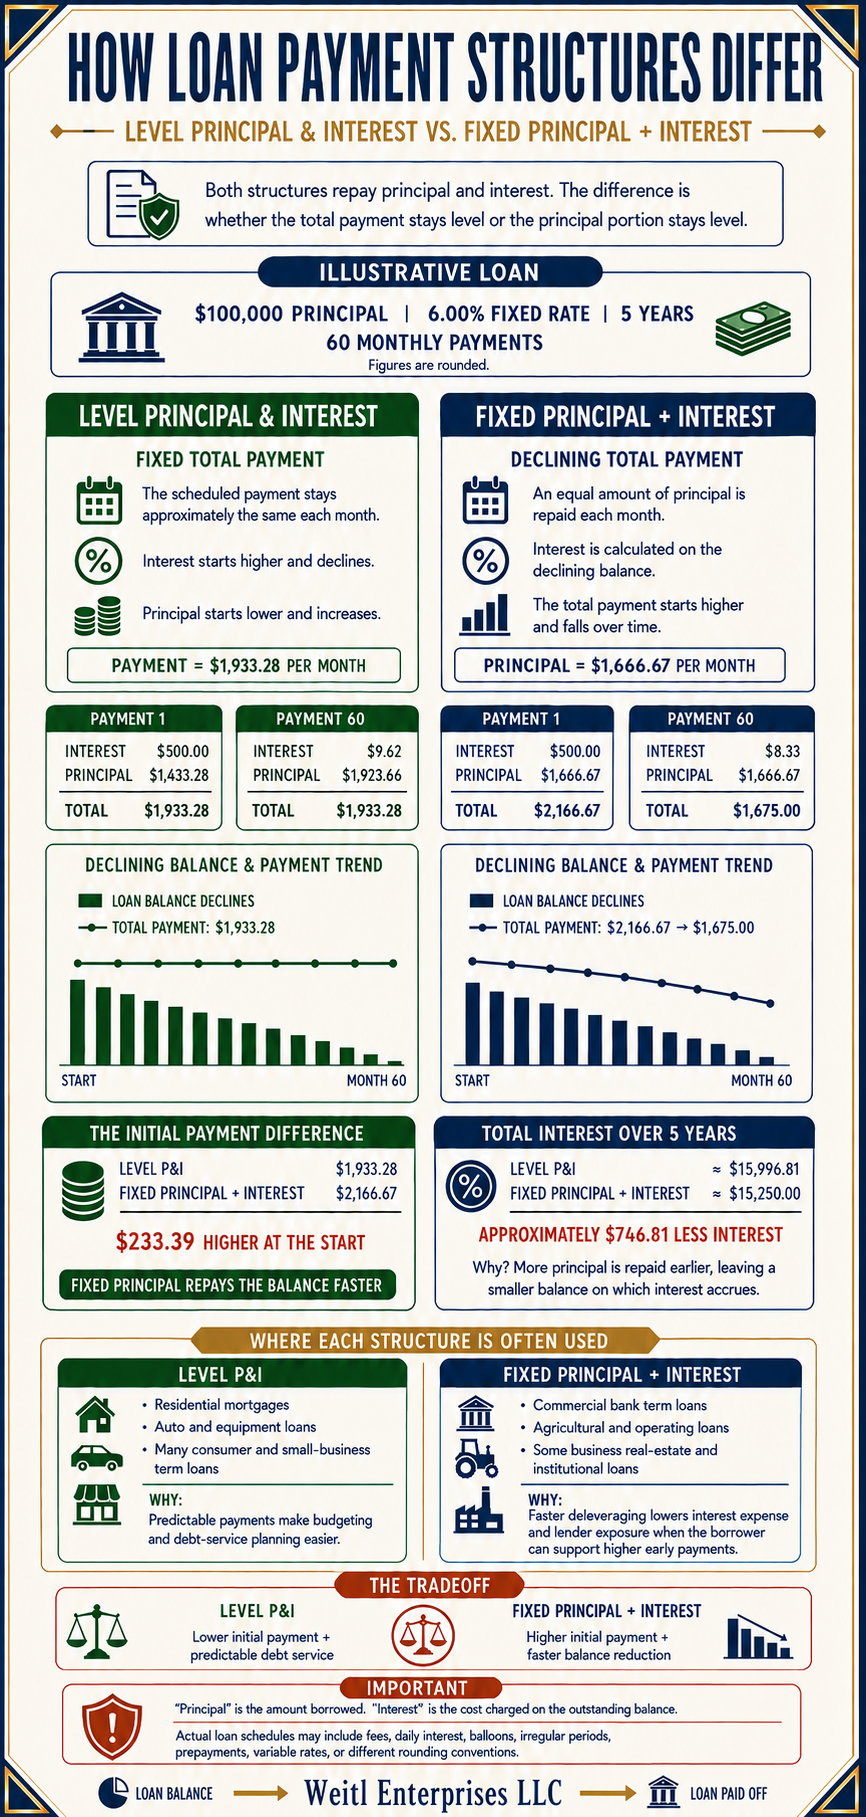
Compare a level principal-and-interest payment with fixed principal plus declining interest, including the initial payment, total interest, repayment pace, and common lending uses.
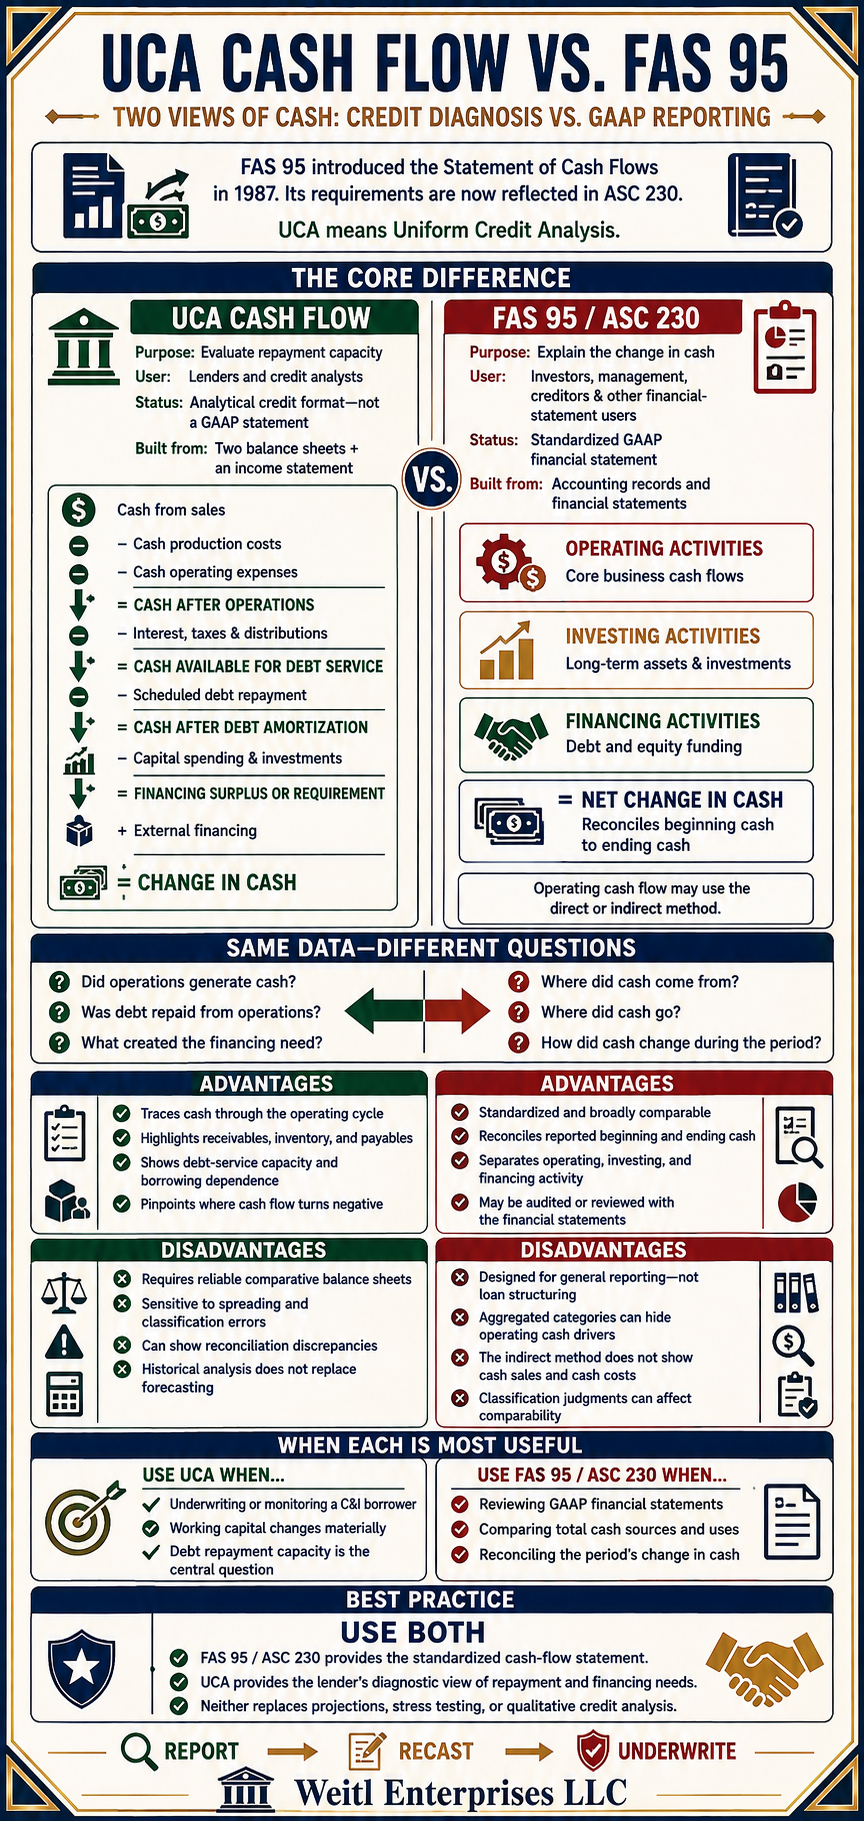
Compare the lender’s diagnostic view of repayment and financing needs with the standardized GAAP statement of operating, investing, and financing cash flows.
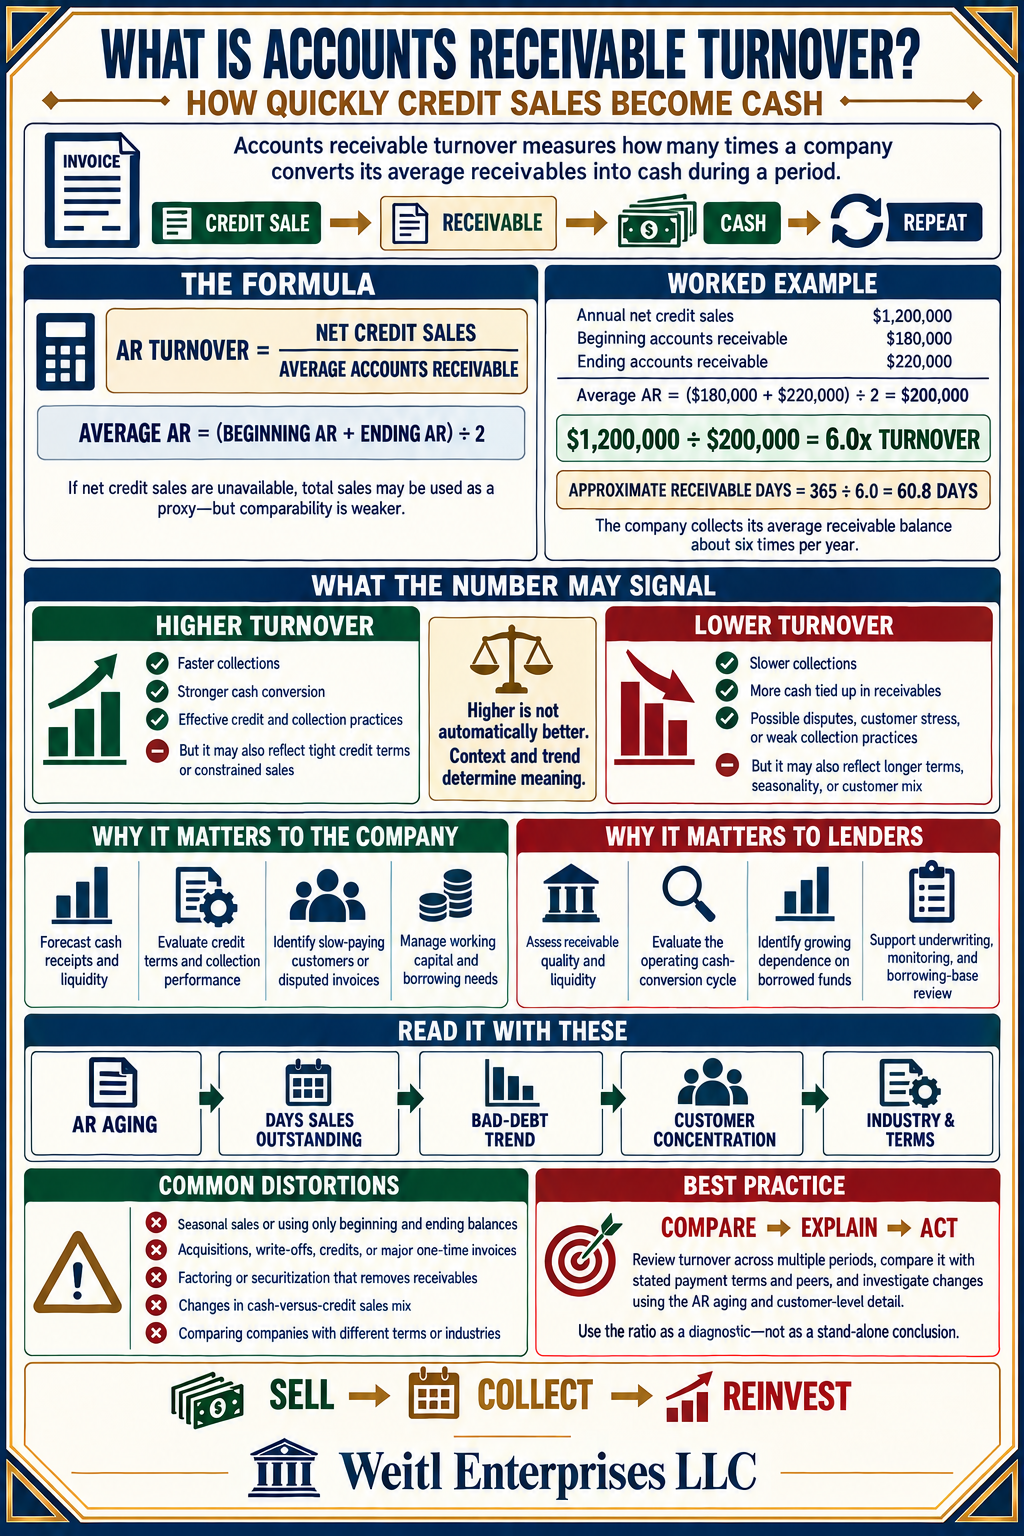
Learn how the ratio measures collection efficiency, how it relates to days sales outstanding, and how companies and lenders interpret higher or lower results.
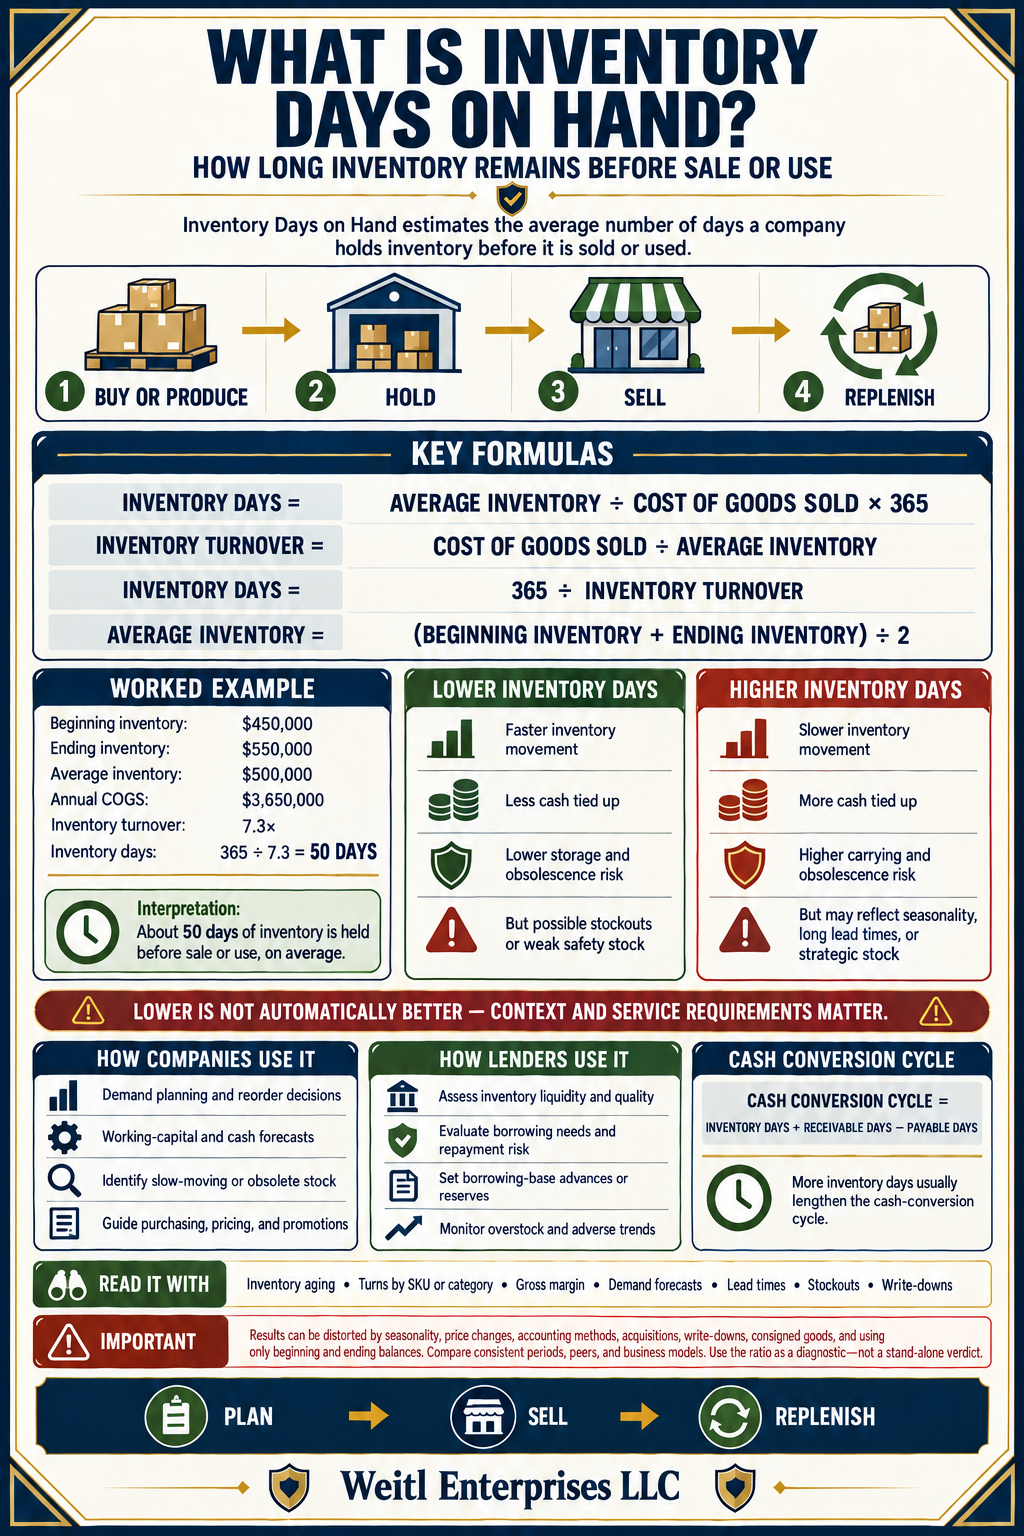
See how long inventory remains before sale or use, what faster and slower movement can indicate, and how inventory days affect liquidity and the cash-conversion cycle.
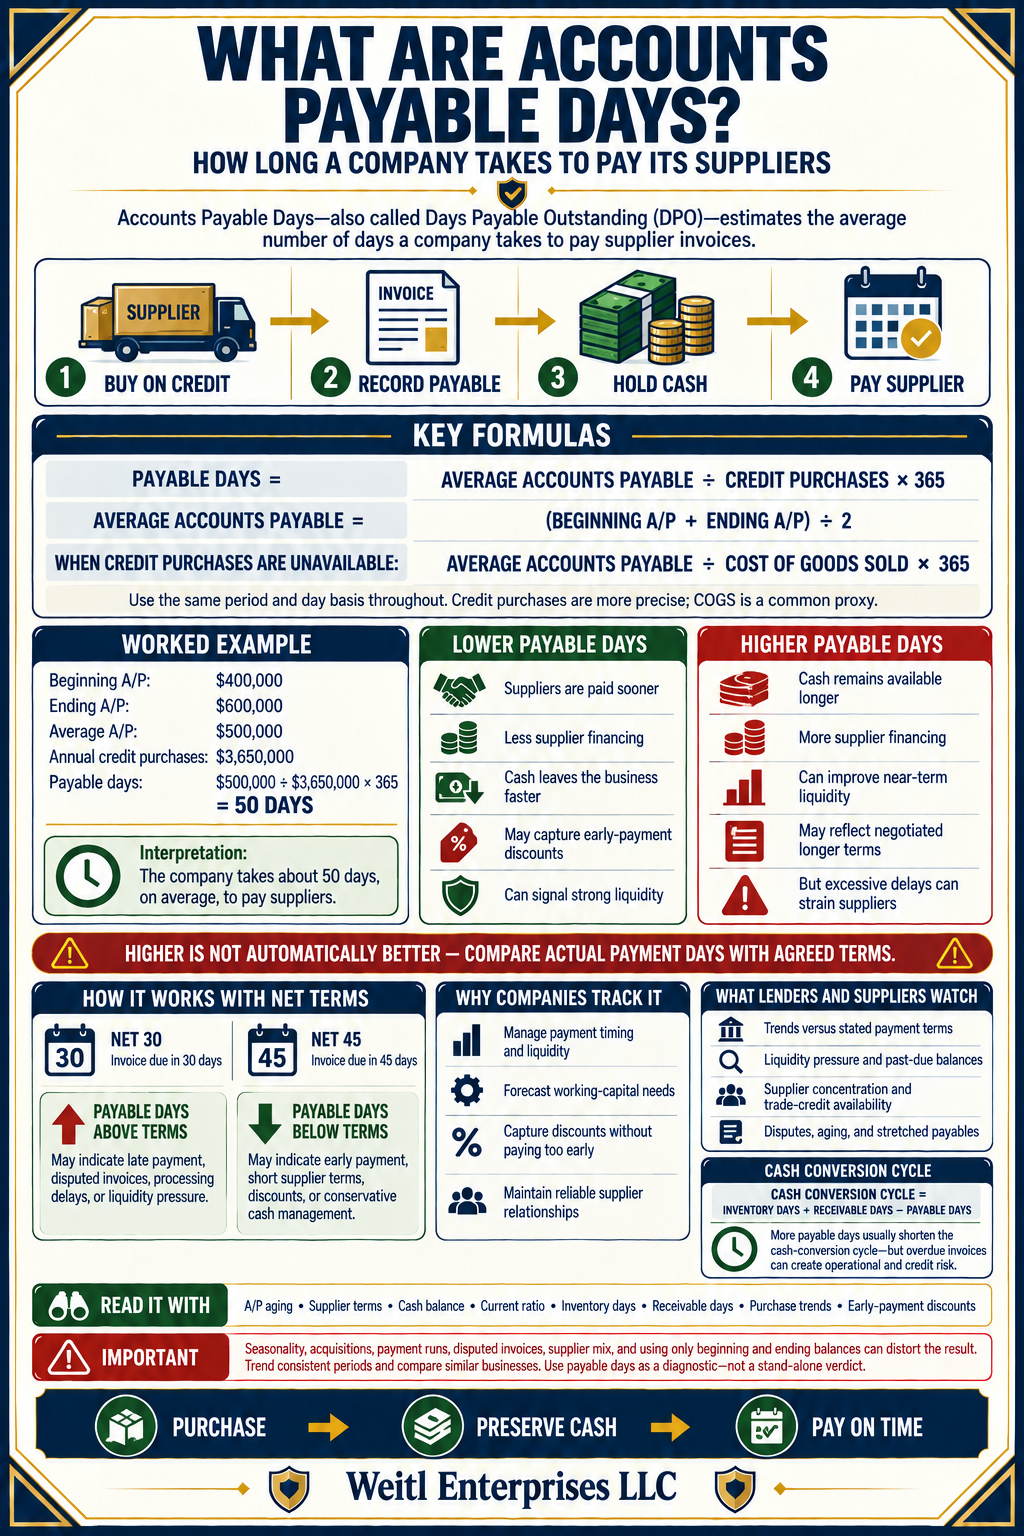
Understand how Days Payable Outstanding measures supplier-payment timing, how it compares with agreed terms, and how it affects cash flow and supplier relationships.
Educational use. These materials provide general explanations, not legal, accounting, investment, or financial advice. Contract terms, underwriting requirements, applicable law, and operational practices may change how each structure functions in a particular relationship.



Featured commentary · September 2026
Credit and Operations Must Work the Same Risk
In a payment service provider, merchant exposure changes after approval. This opinion piece sets out how Credit and Operations can share the signals, decisions, and accountability needed to respond.
Opinion · Peter Weitl · Four-page PDF
One merchant. One exposure.
Credit turns approval into usable operating terms. Operations brings back evidence from settlement, refunds, disputes, and merchant behavior. The article also identifies four opportunities for AI-assisted work, with their benefits, pitfalls, and required controls.